Empirical Evaluation of Fault Localisation Using Code and Change Metrics
This page includes full results of RQ5, RQ6, and RQ7 in the paper, "Empirical Evaluation of Fault Localisation Using Code and Change Metrics".
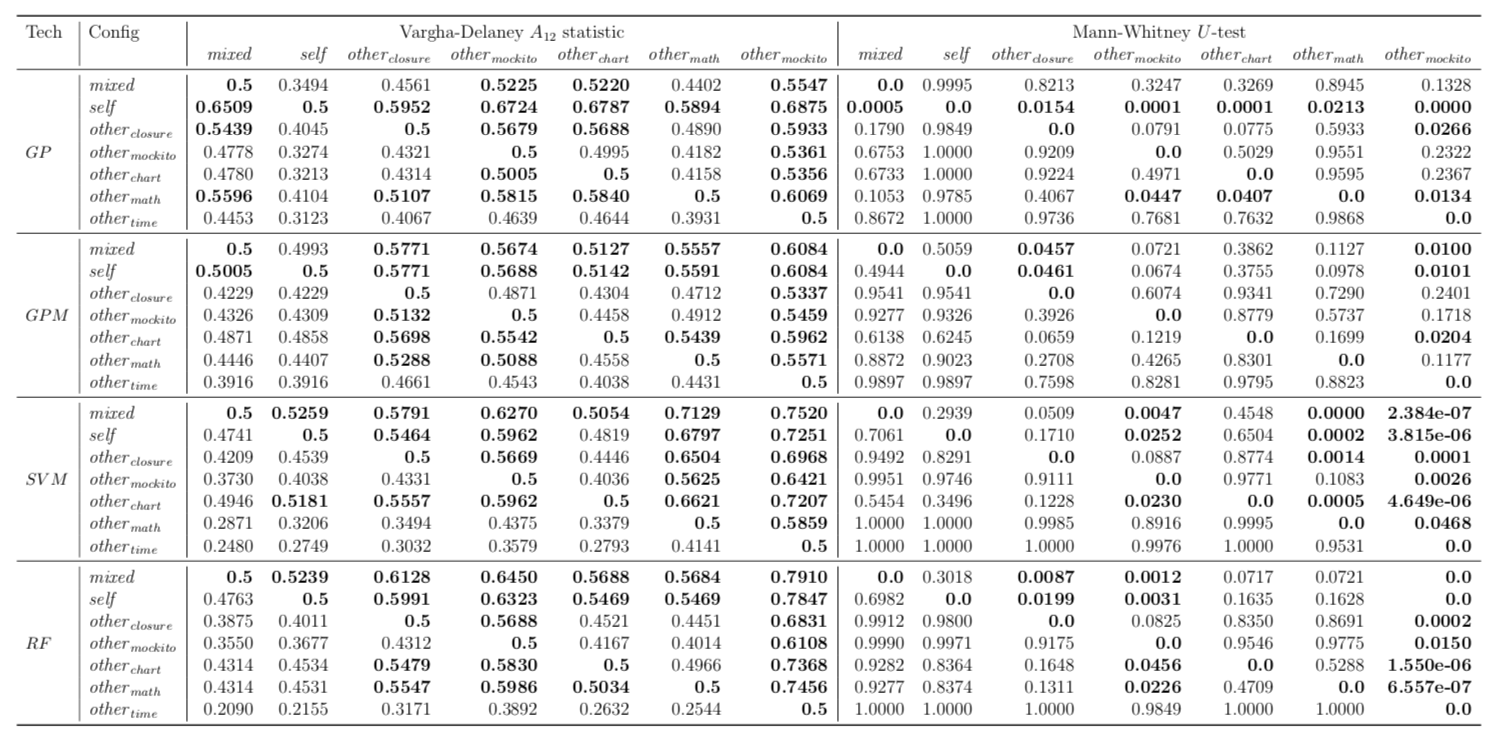
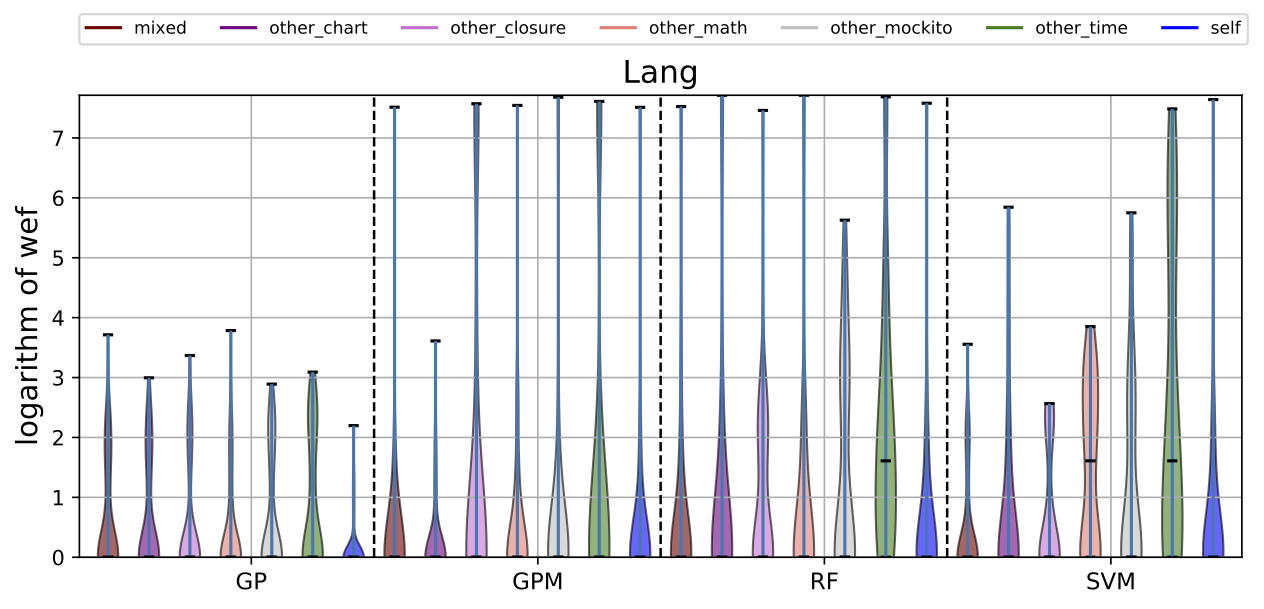
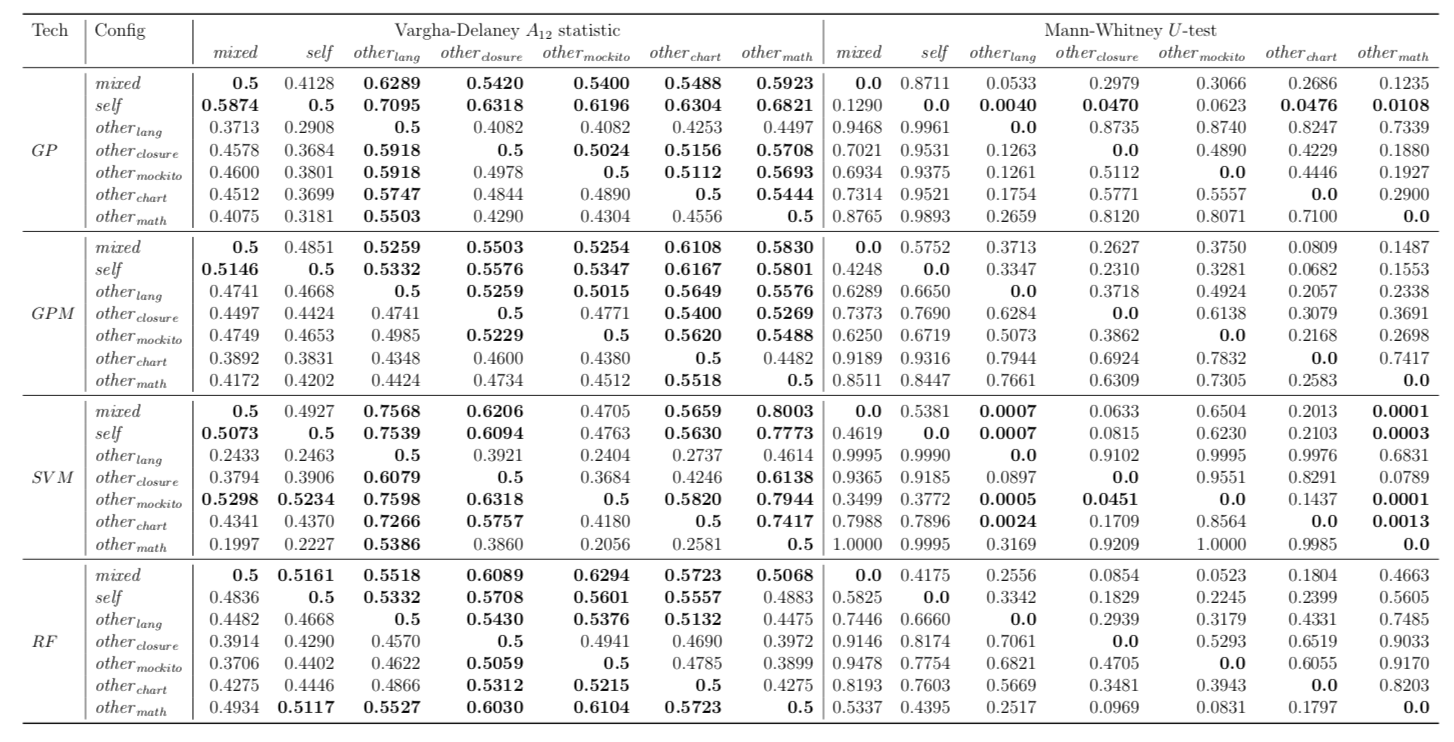
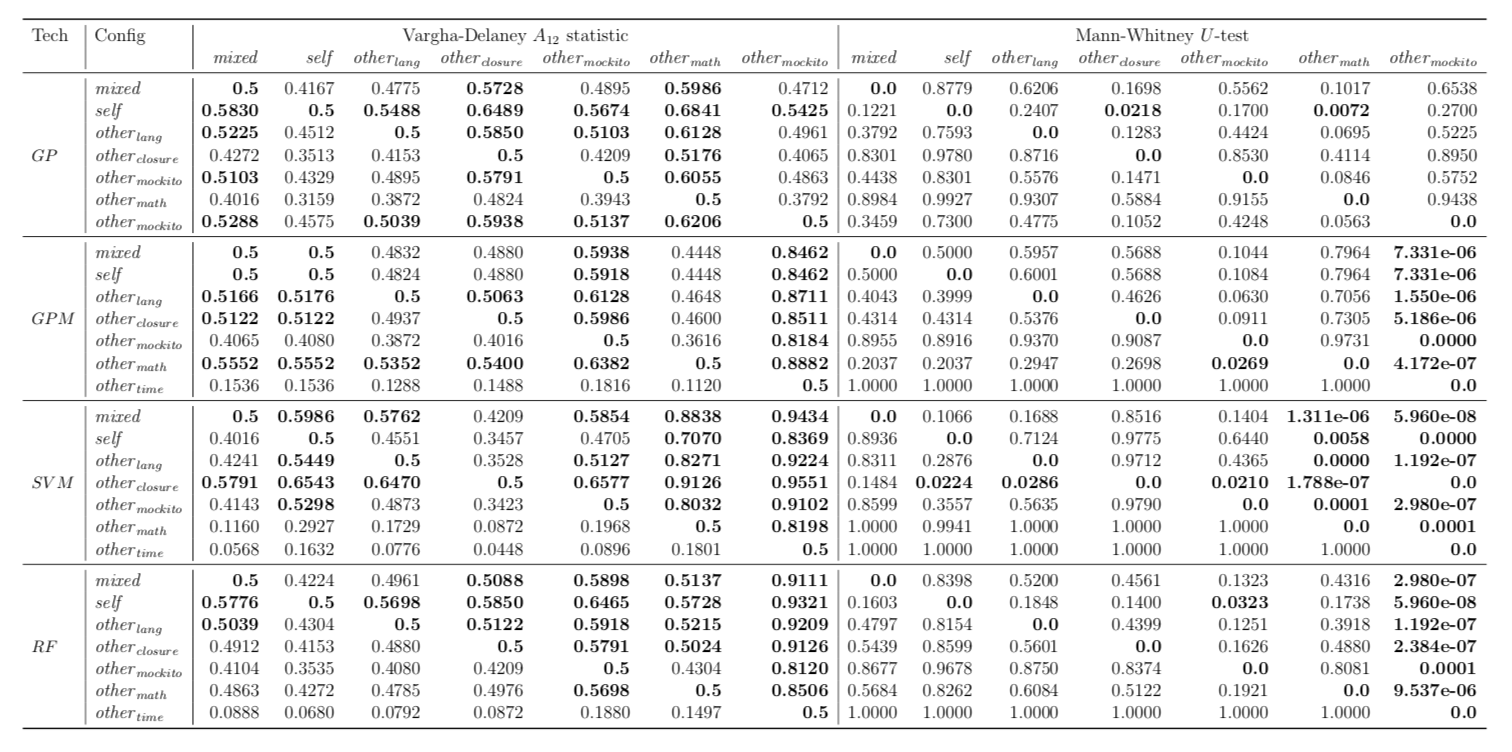
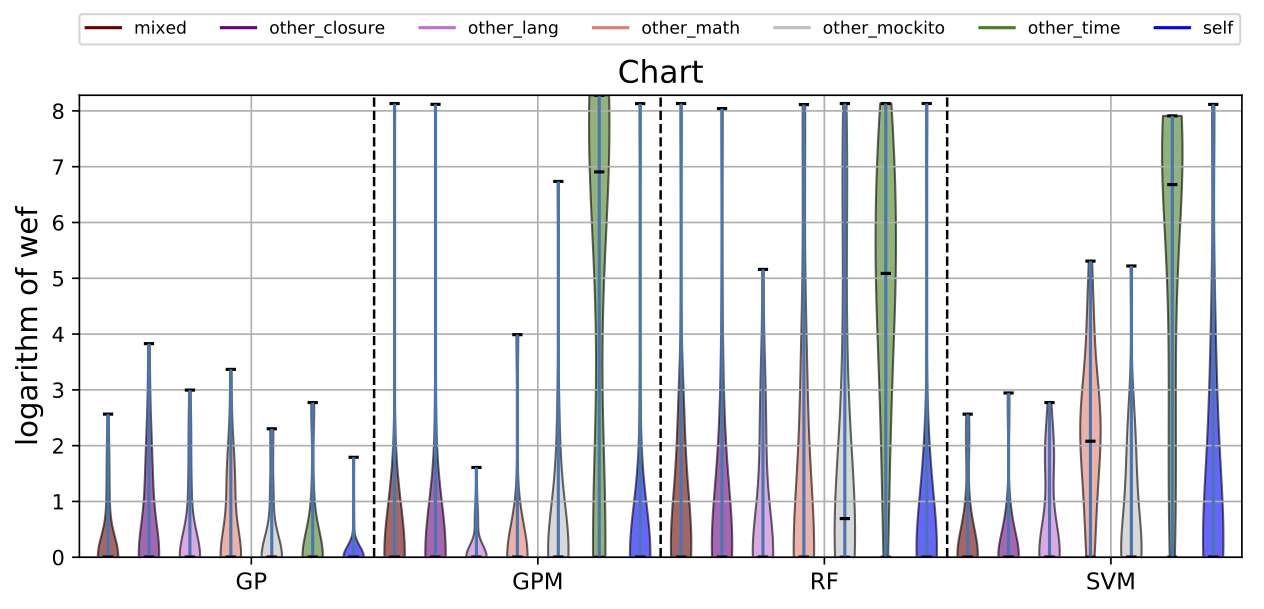
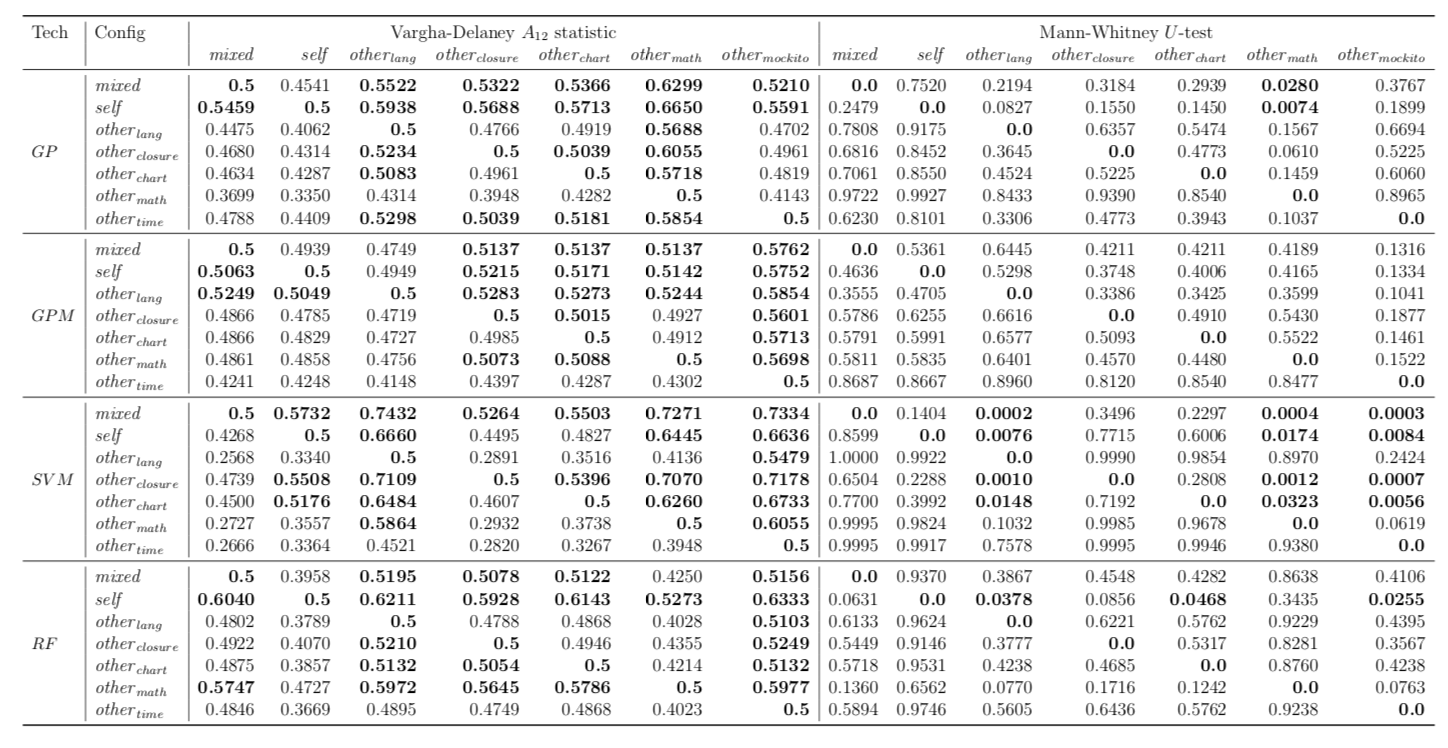
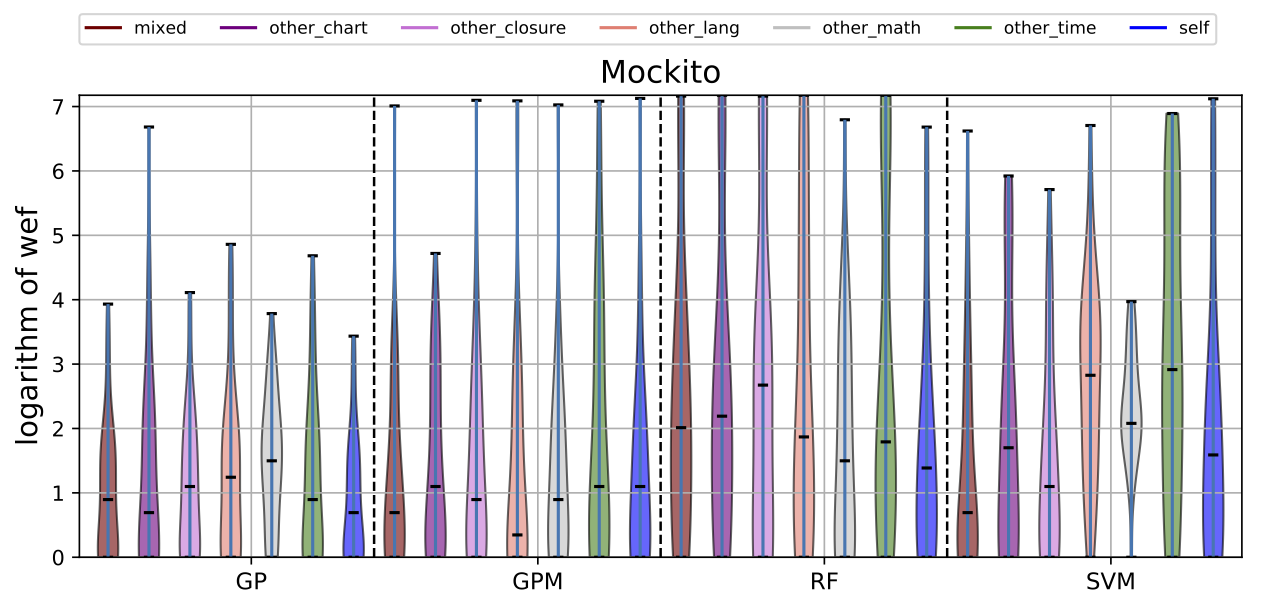
RQ5. Existence of project-specific traits that are effective for fault localisation
Performance of trained models depends on whether these models have succeeded to catch useful features for fault localisation. In RQ5, we ask: does each project have any unique traits that might affect the effectiveness of fault localisation? To answer this question, we define three different training data configurations and compare the performance of FLUCCS with them.
| Lang |
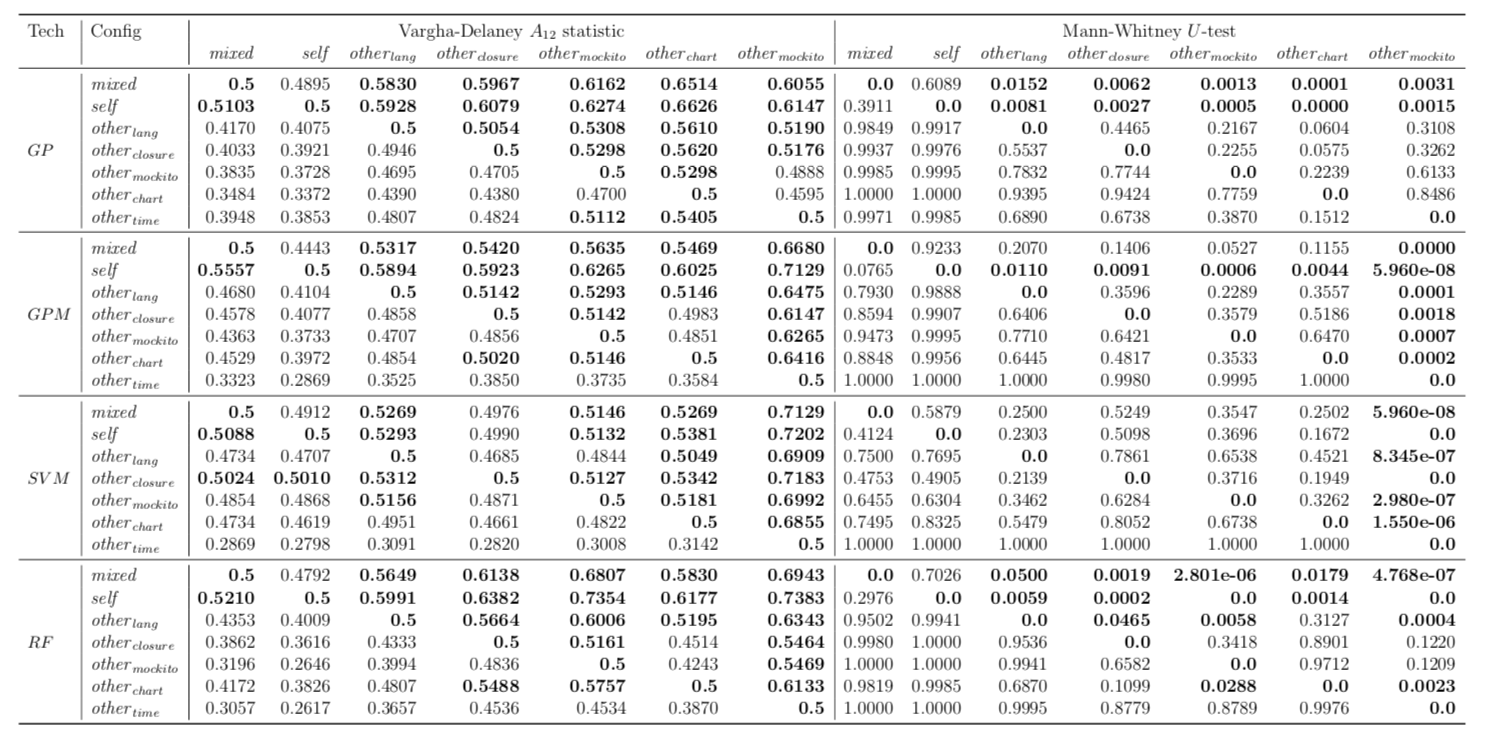
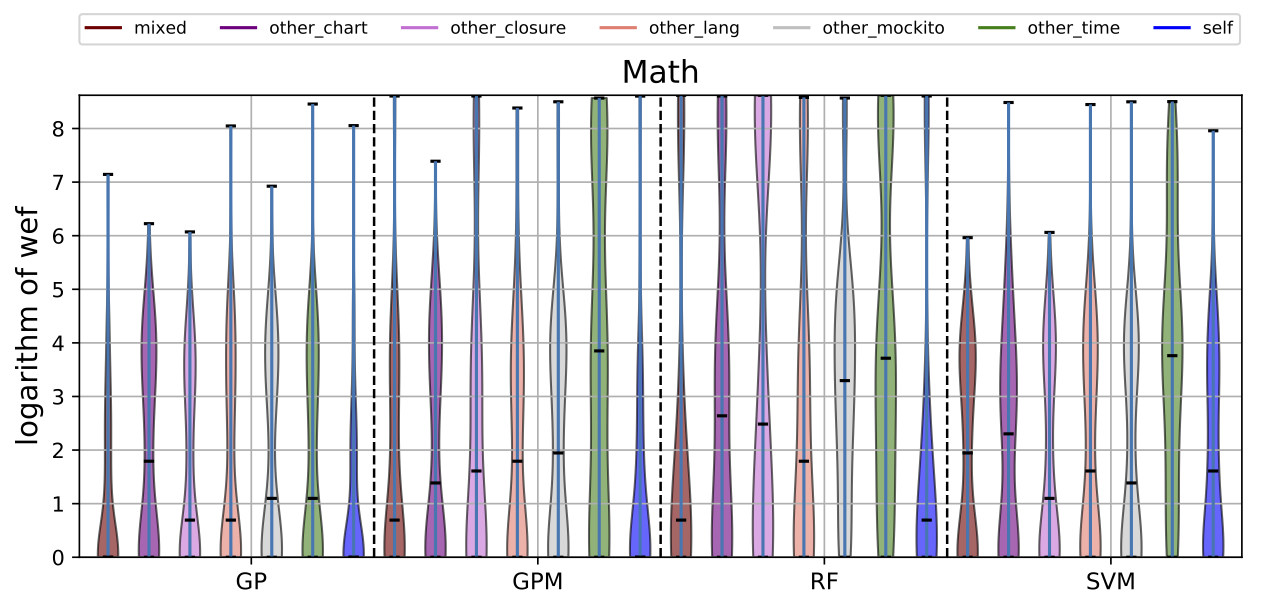
| Math |
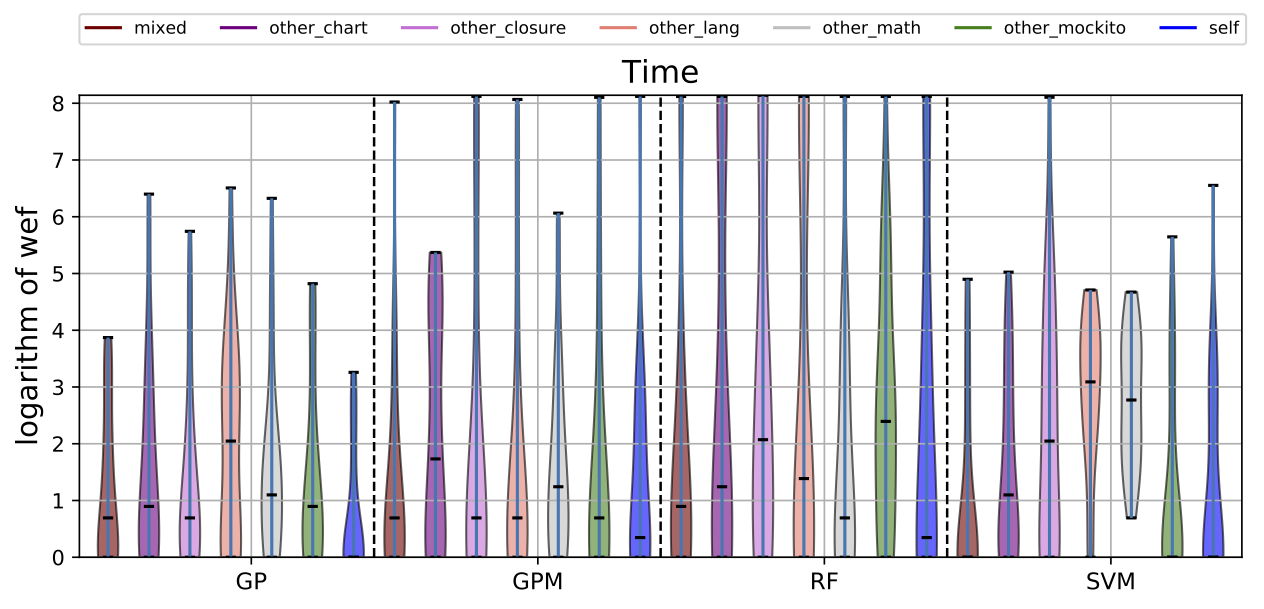
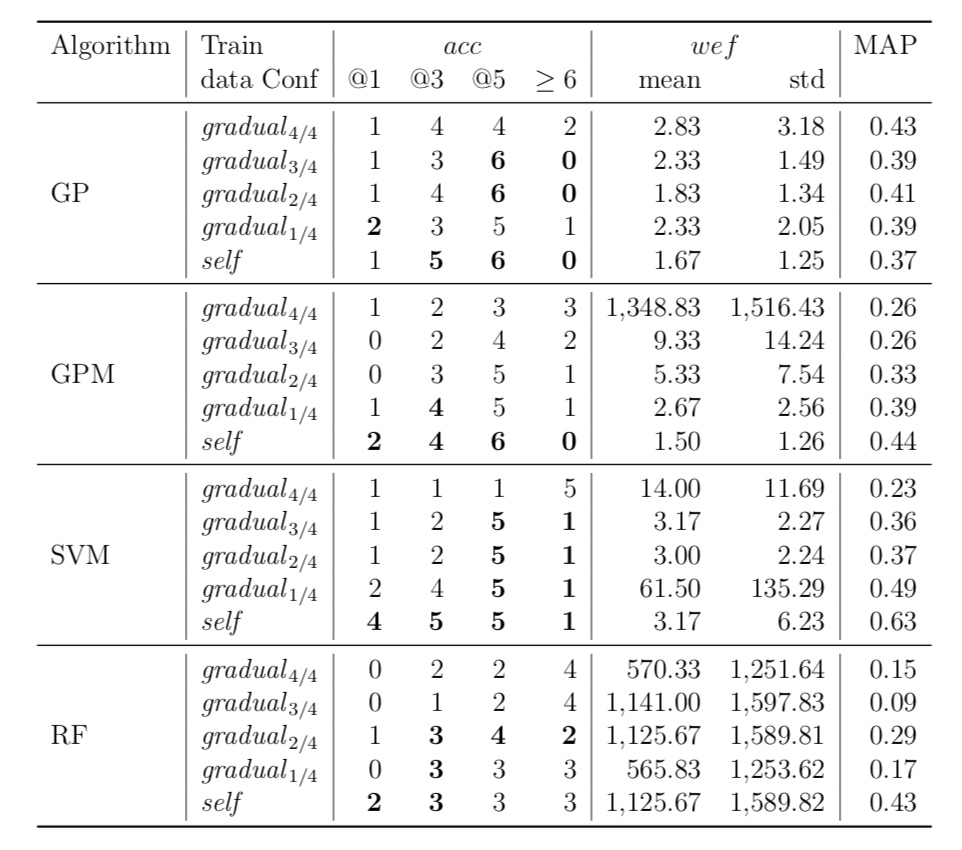
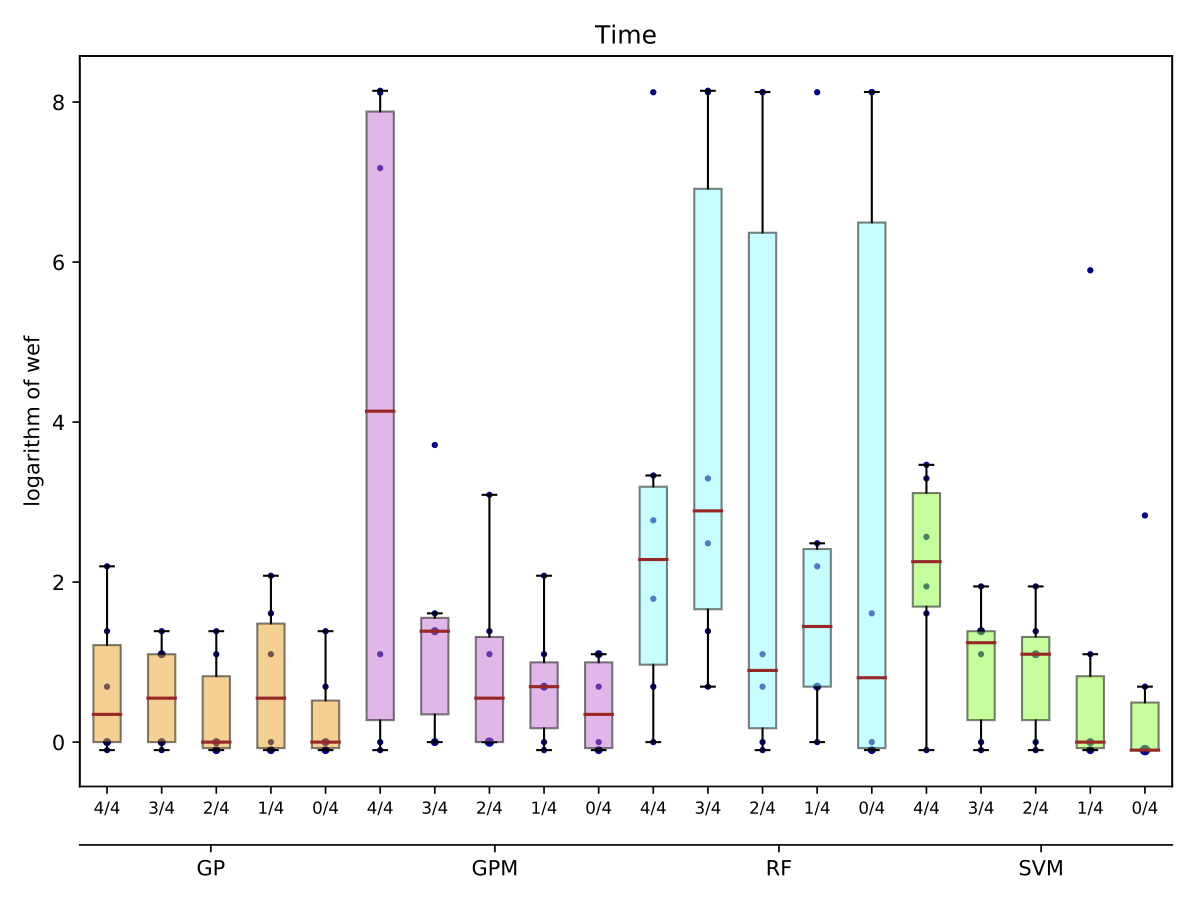
| Time |
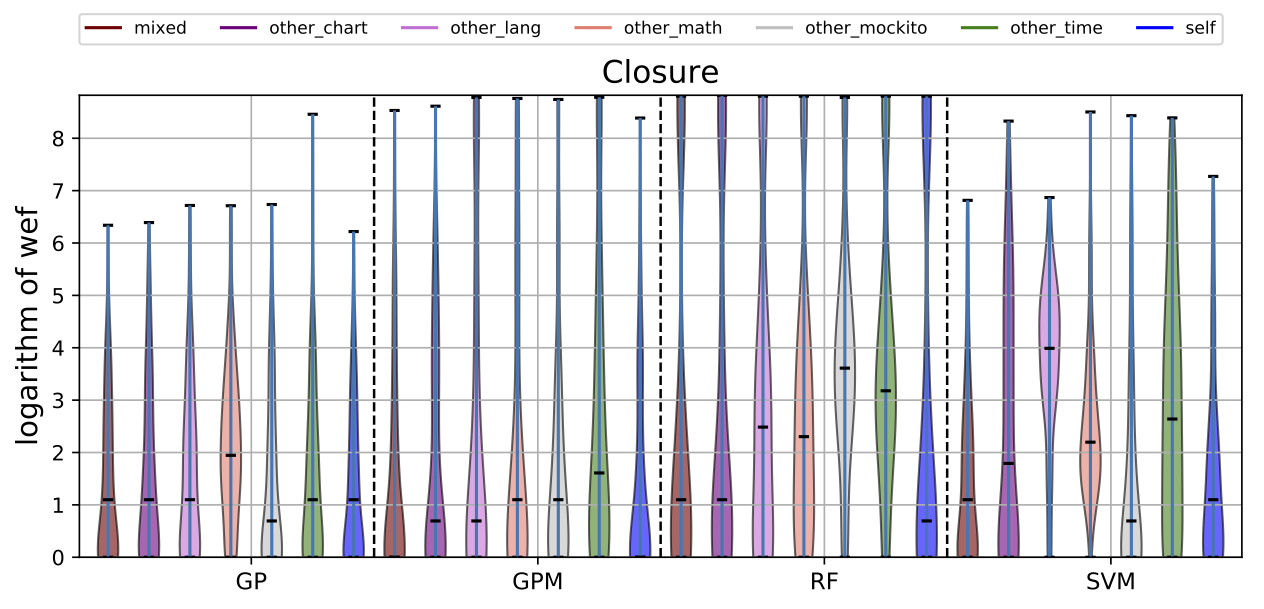
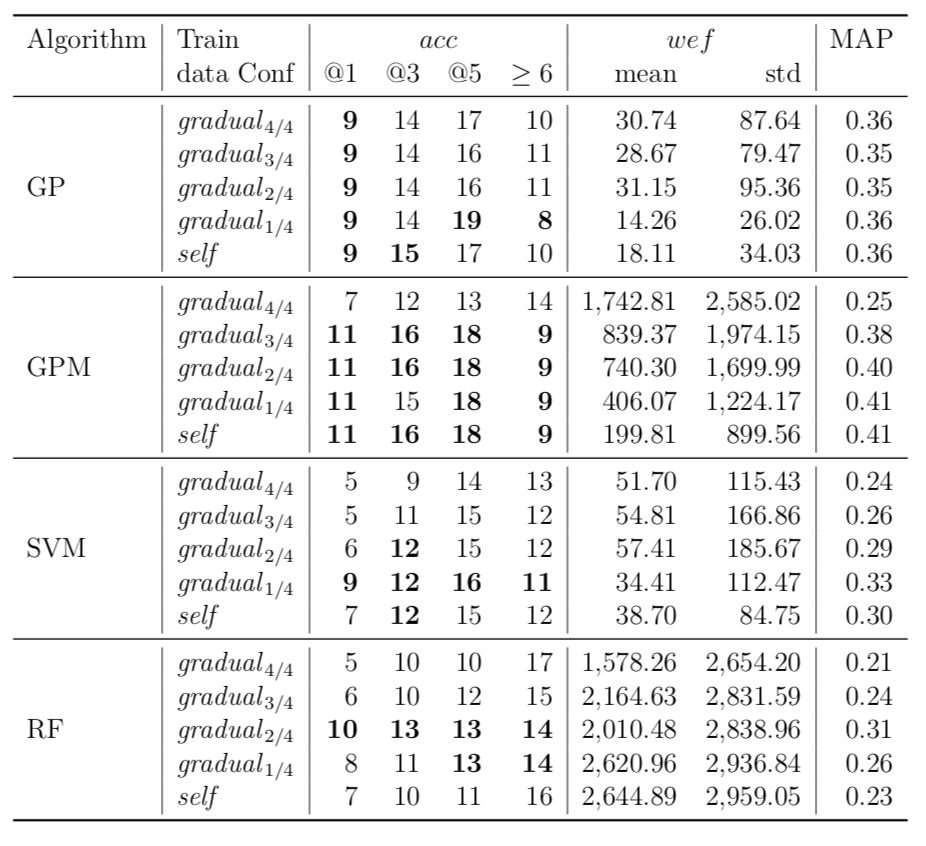
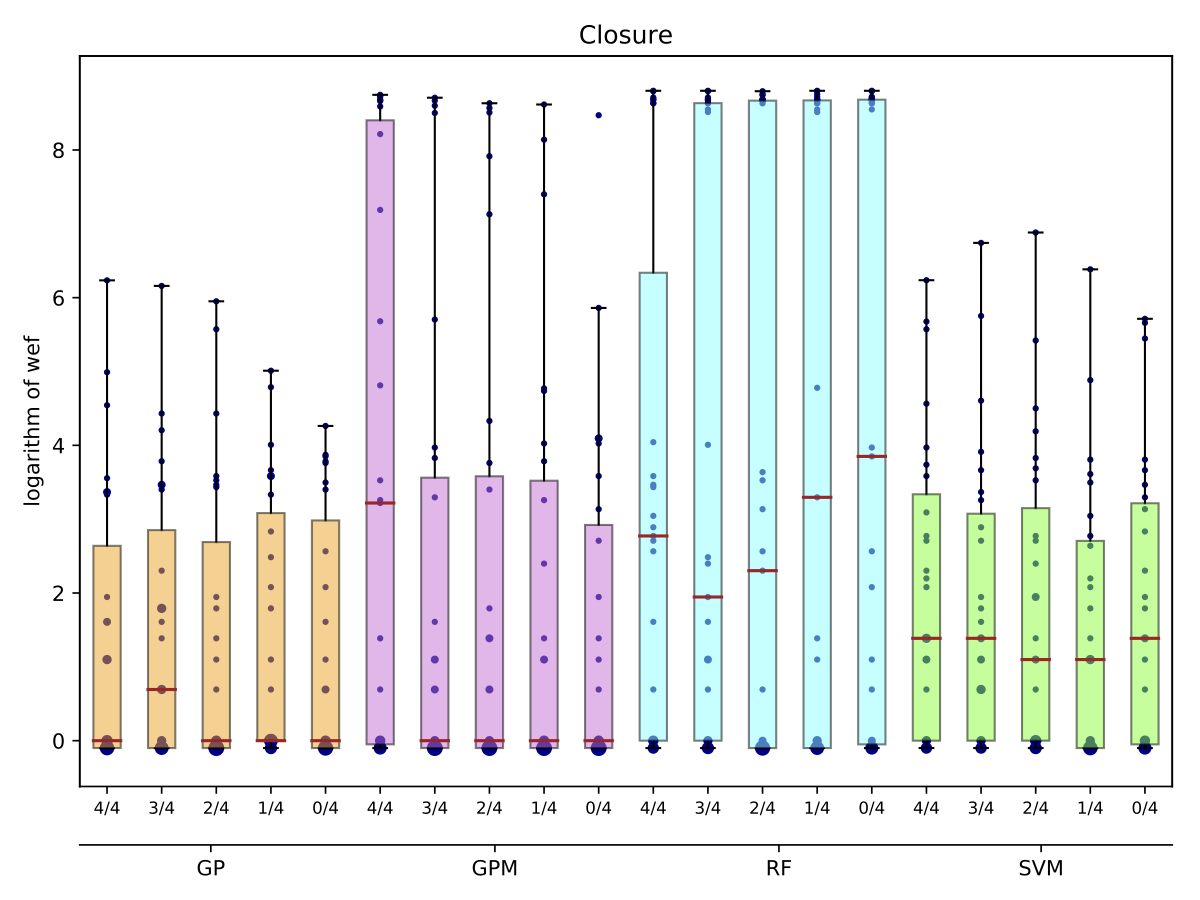
| Closure |
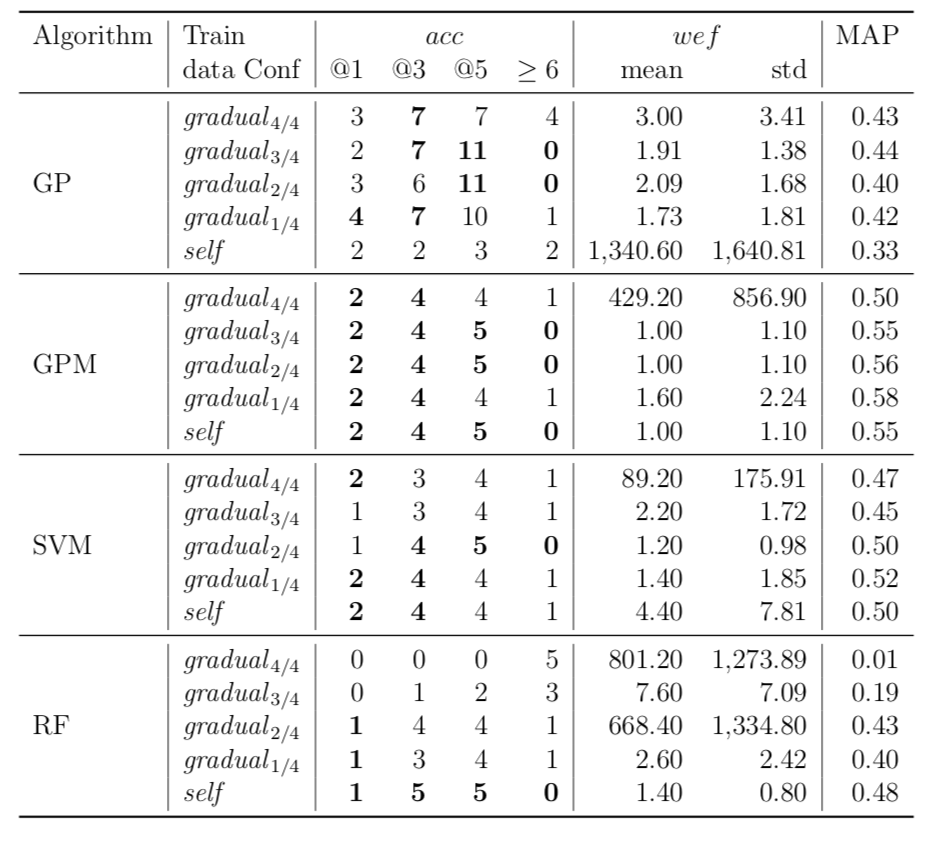
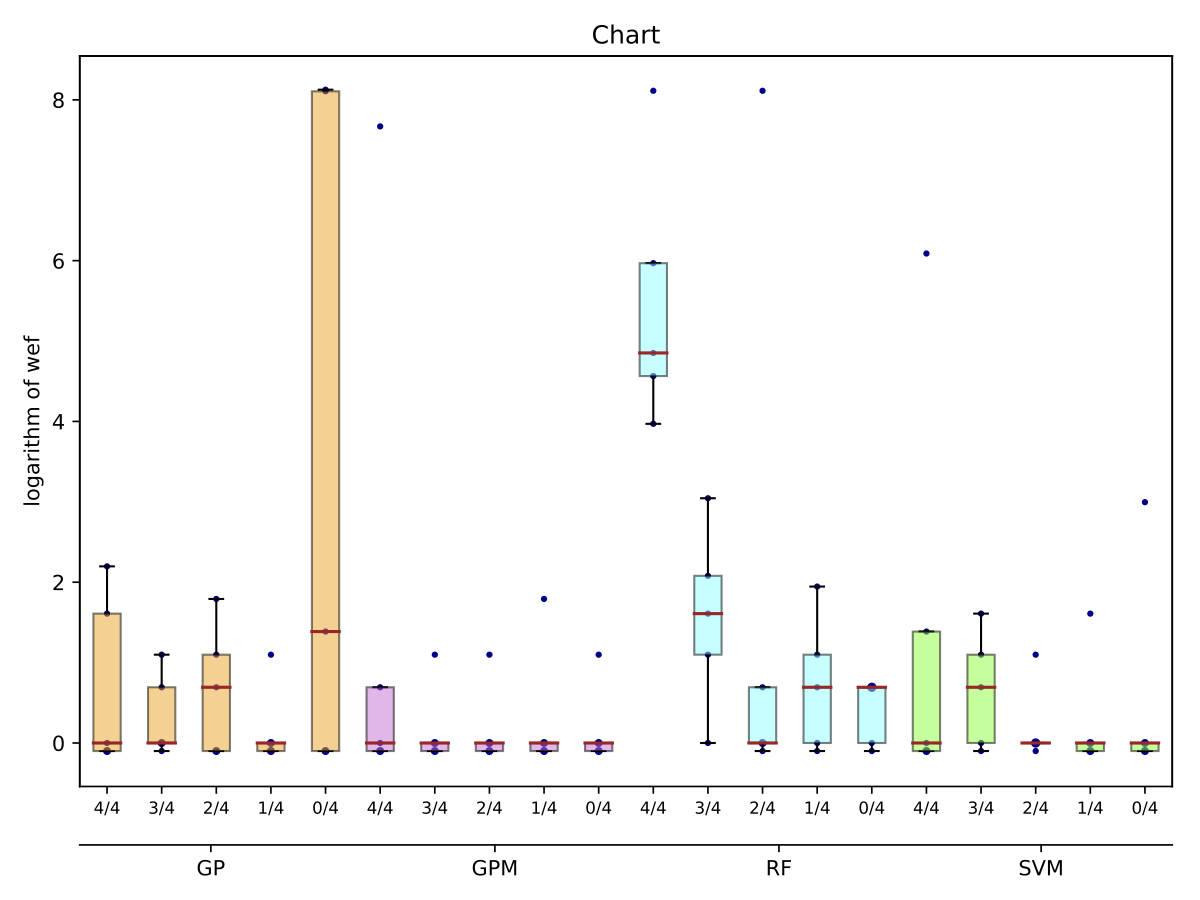
| Chart |
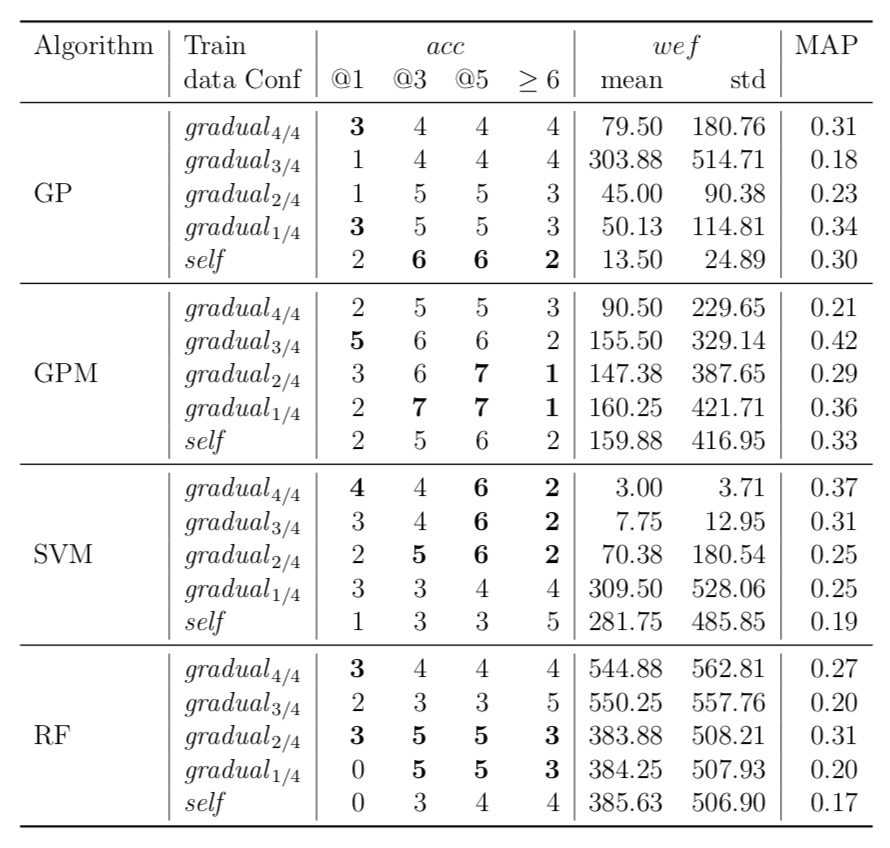
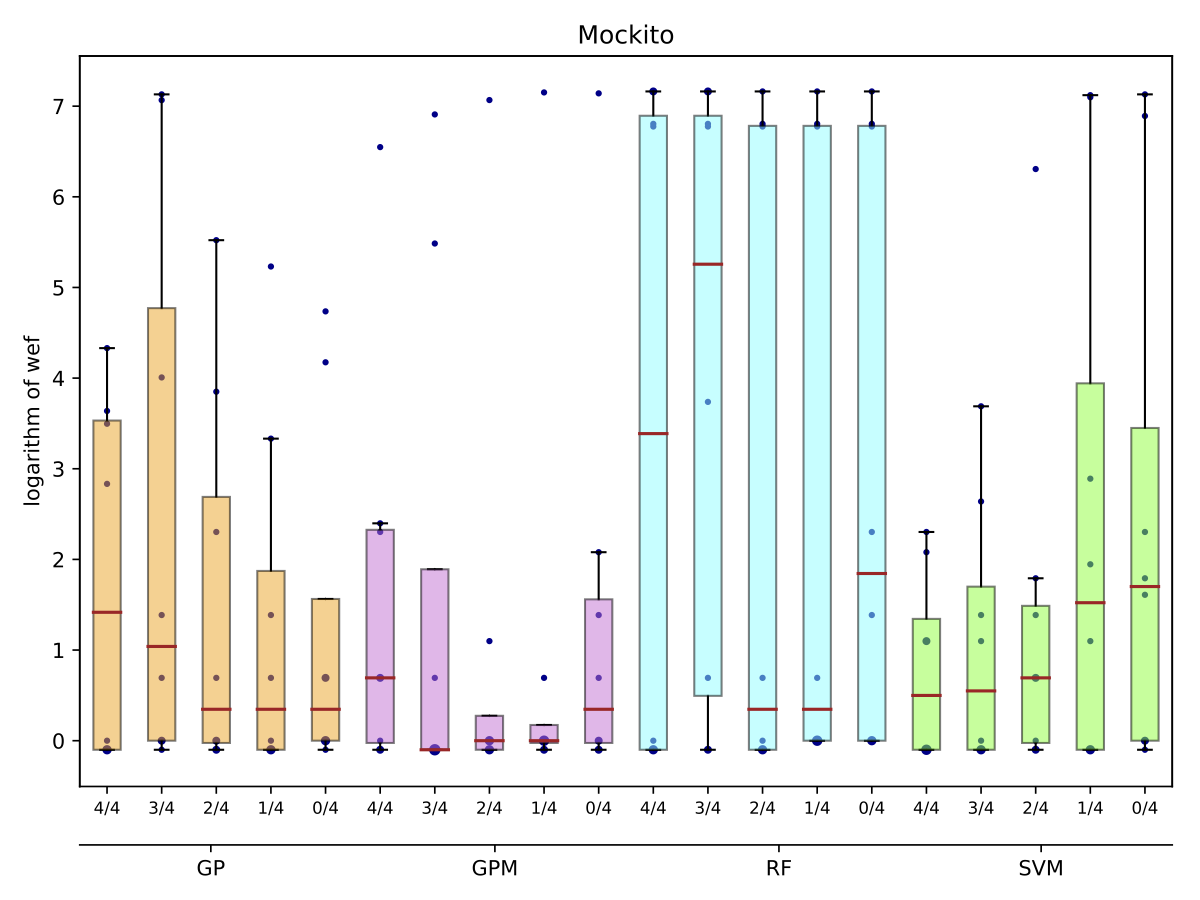
| Mockito |
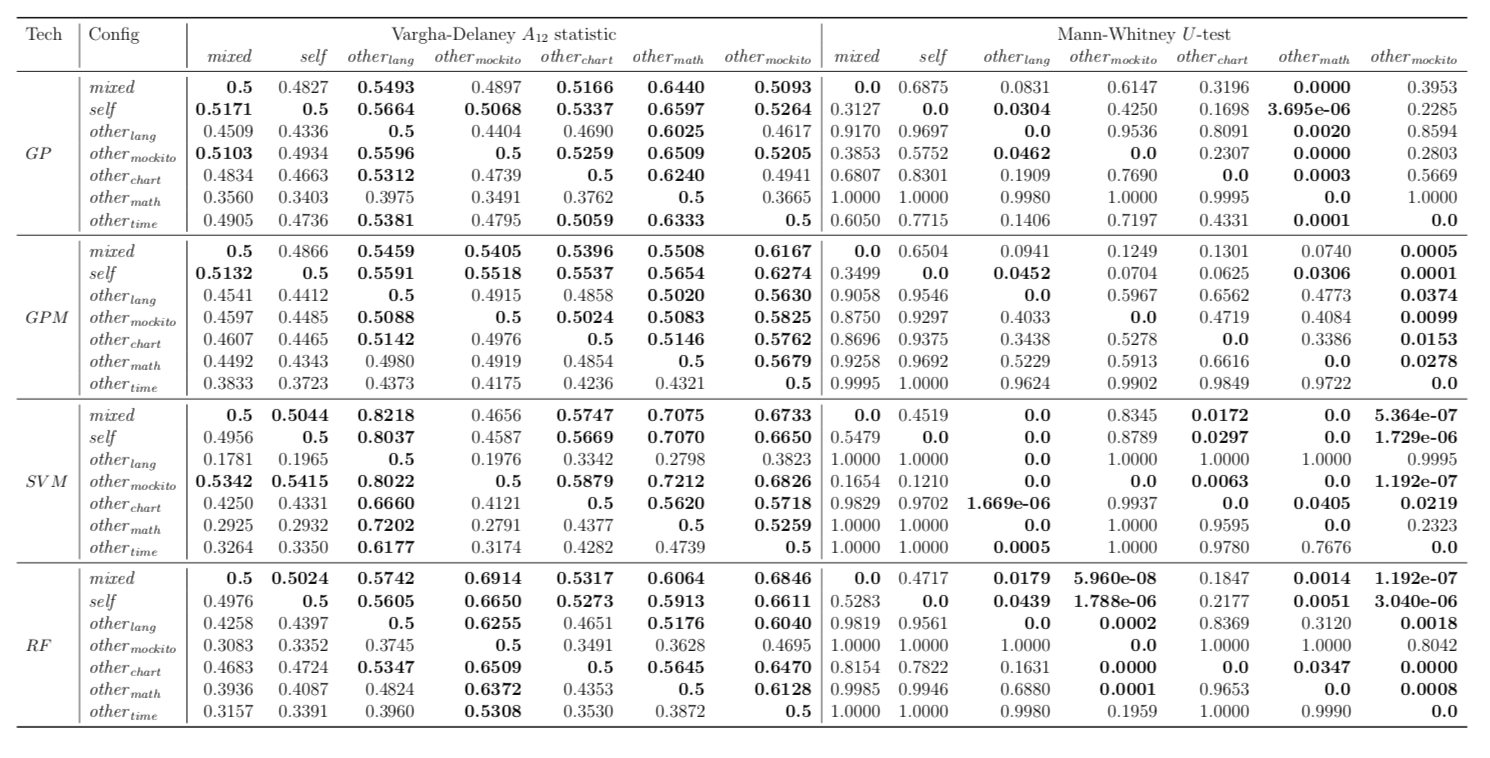
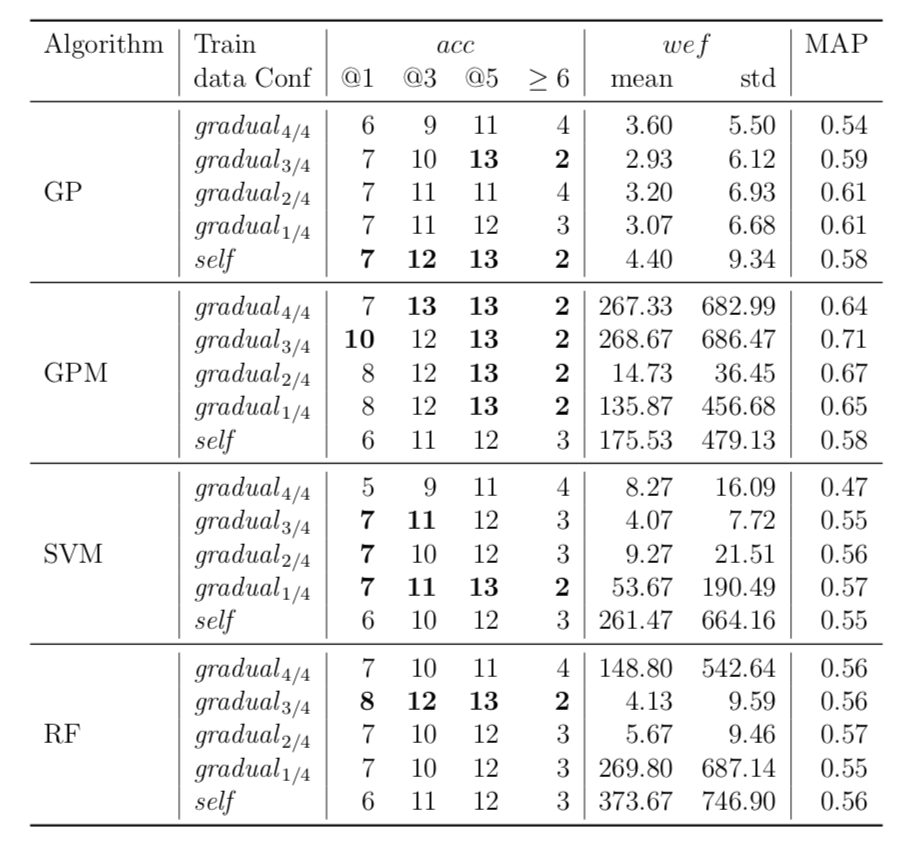
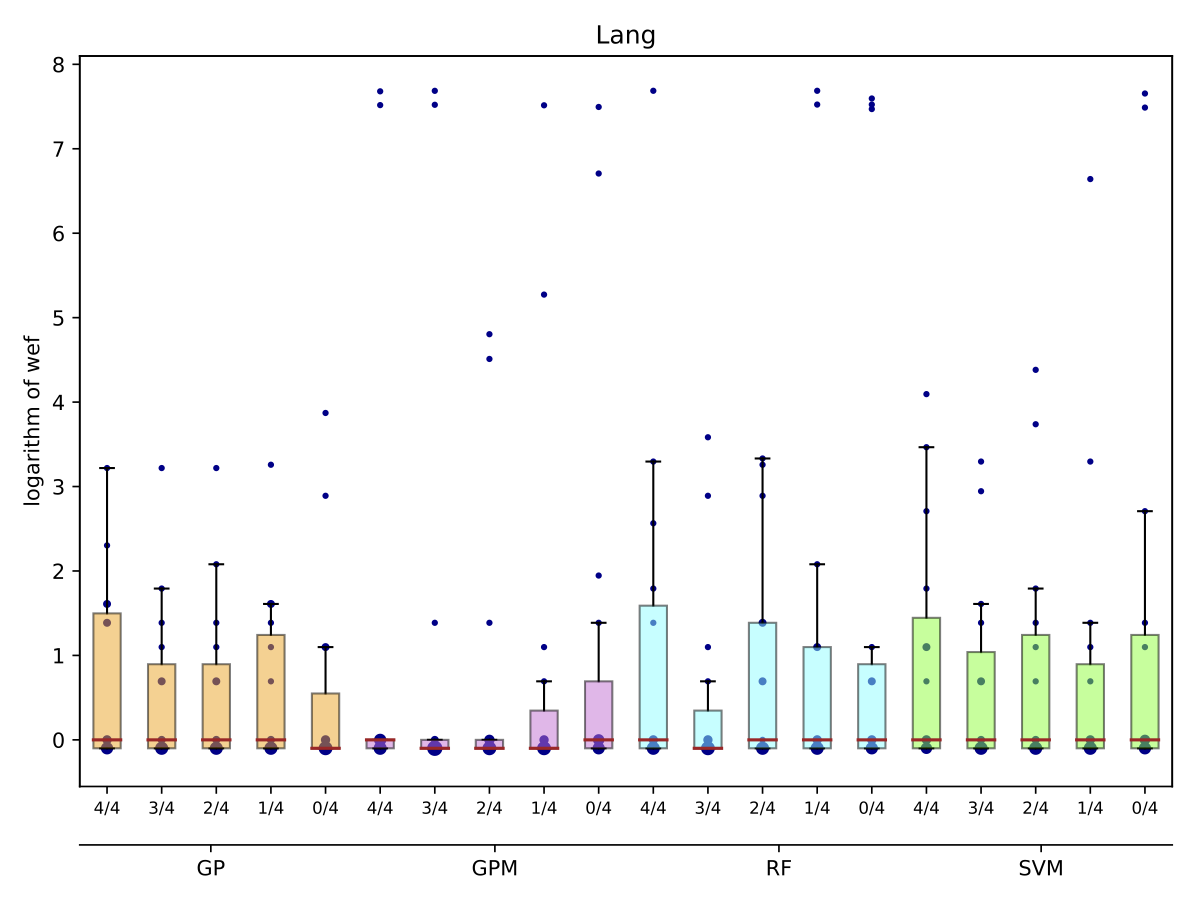
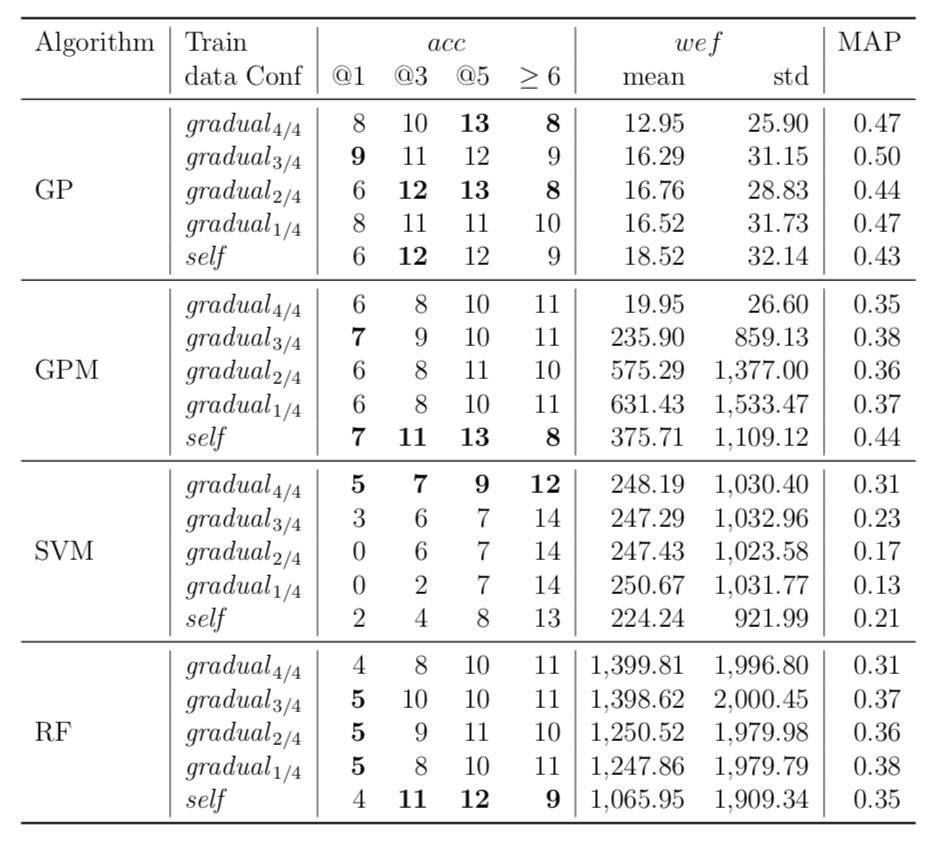
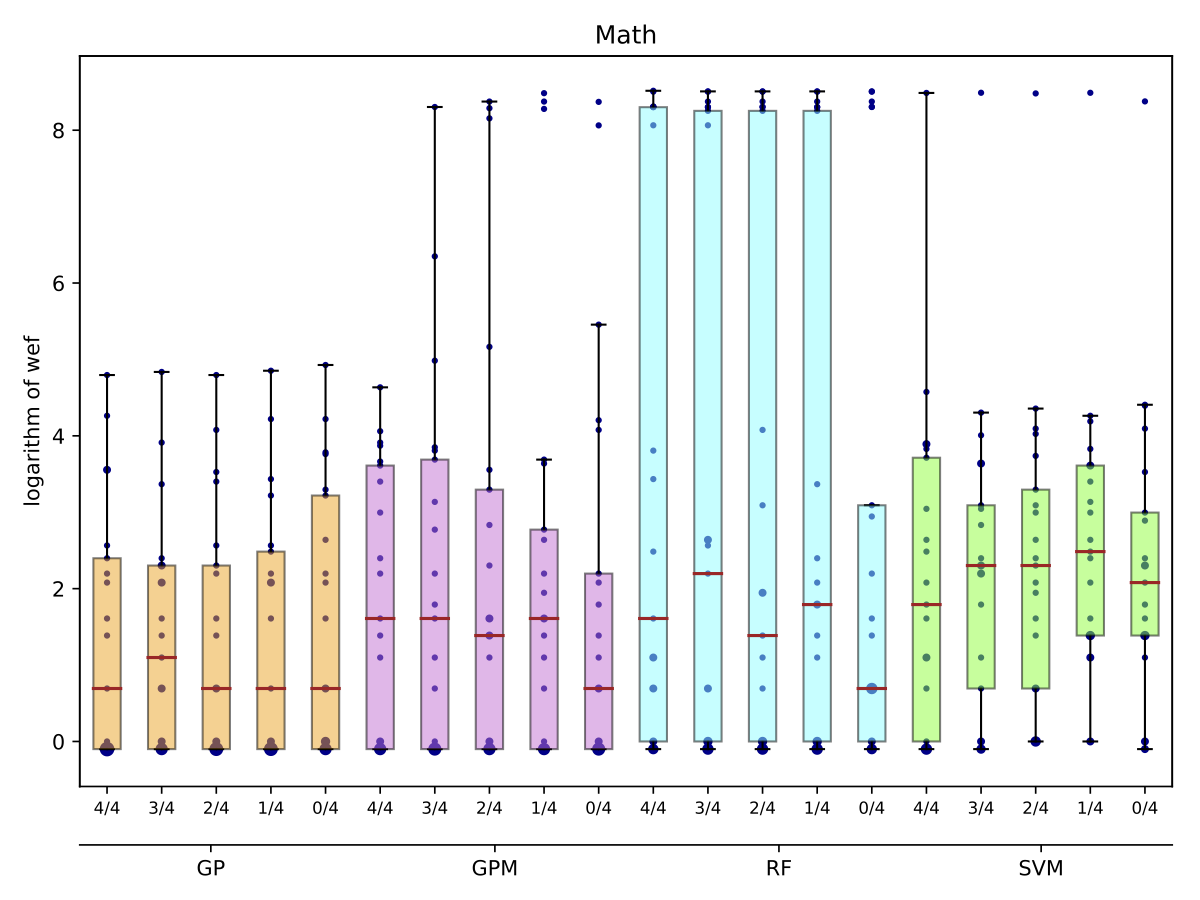
RQ6. Gradual Cross-Project Training
While there may exist project-specific traits that may improve the performance of fault localisation under the self configuration, learning only from the faults of a test subject may not always be a viable option. For example, if the test subject is in the early stage of development, there may not be enough faults to exploit, yet; in this case, the cross-project learning may be the only feasible option. In RQ6, we ask: when should we transit from cross-project to own configuration? To answer this question, we perform gradual cross-project learning, which varies the ratio of the faults from the subject and the faults from other projects in the training dataset. For this experiment, we define an additional configuration of the training data set, others.
| Lang |
| Math |
| Time |
| Closure |
| Chart |
| Mockito |
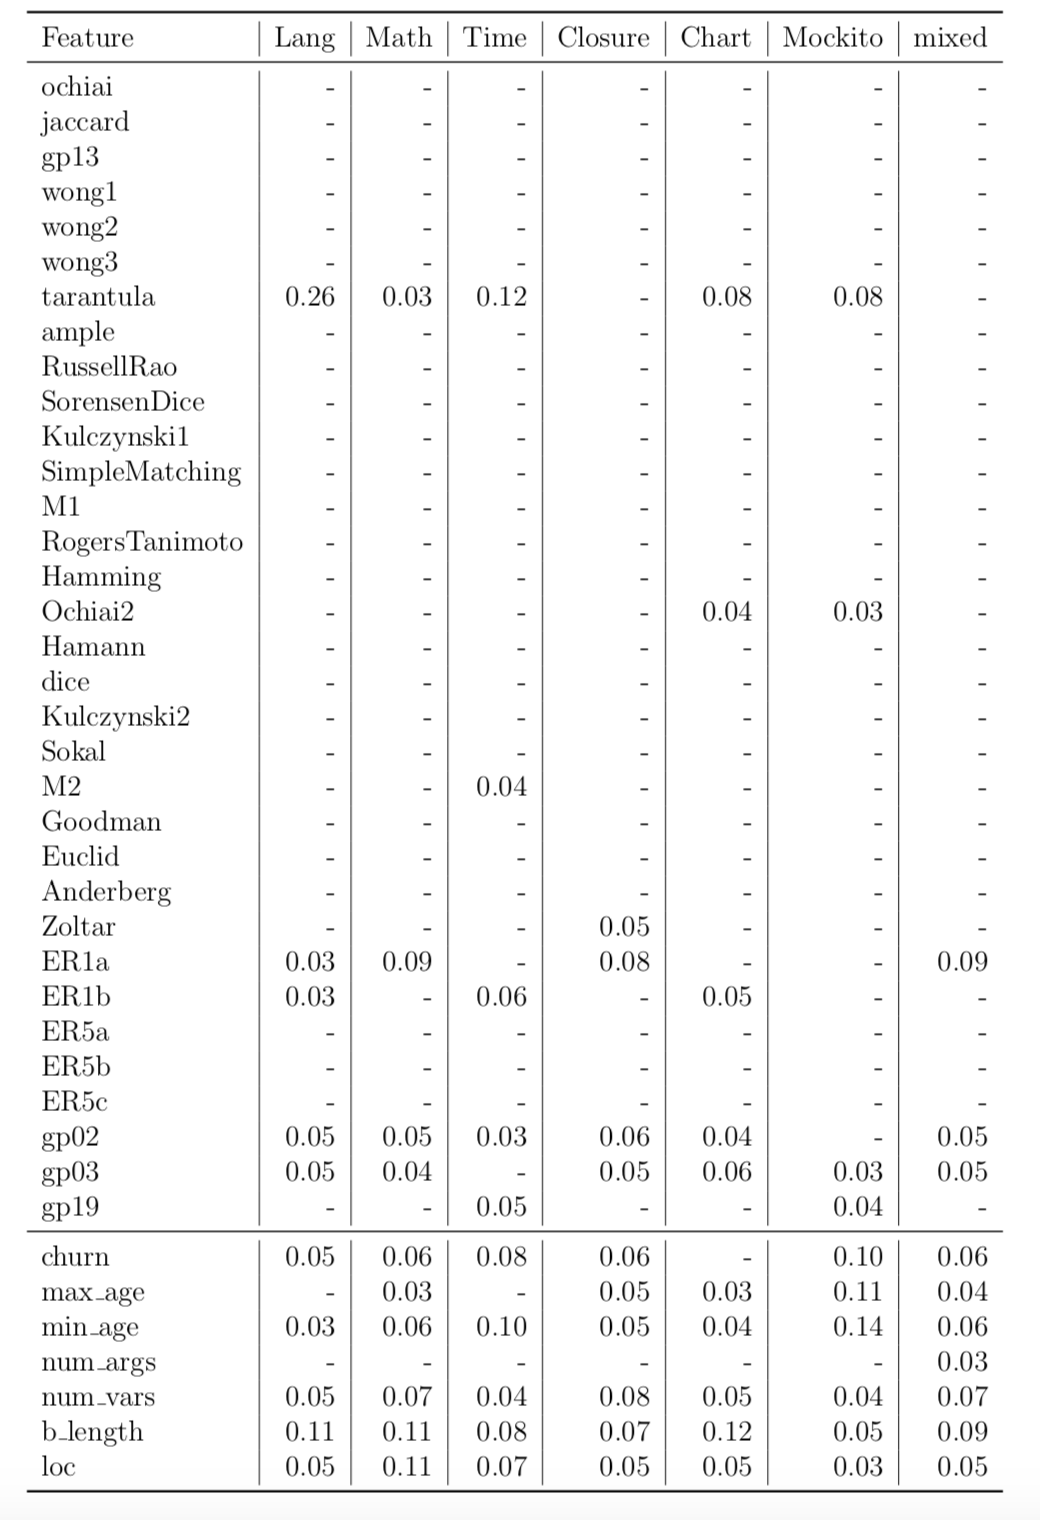
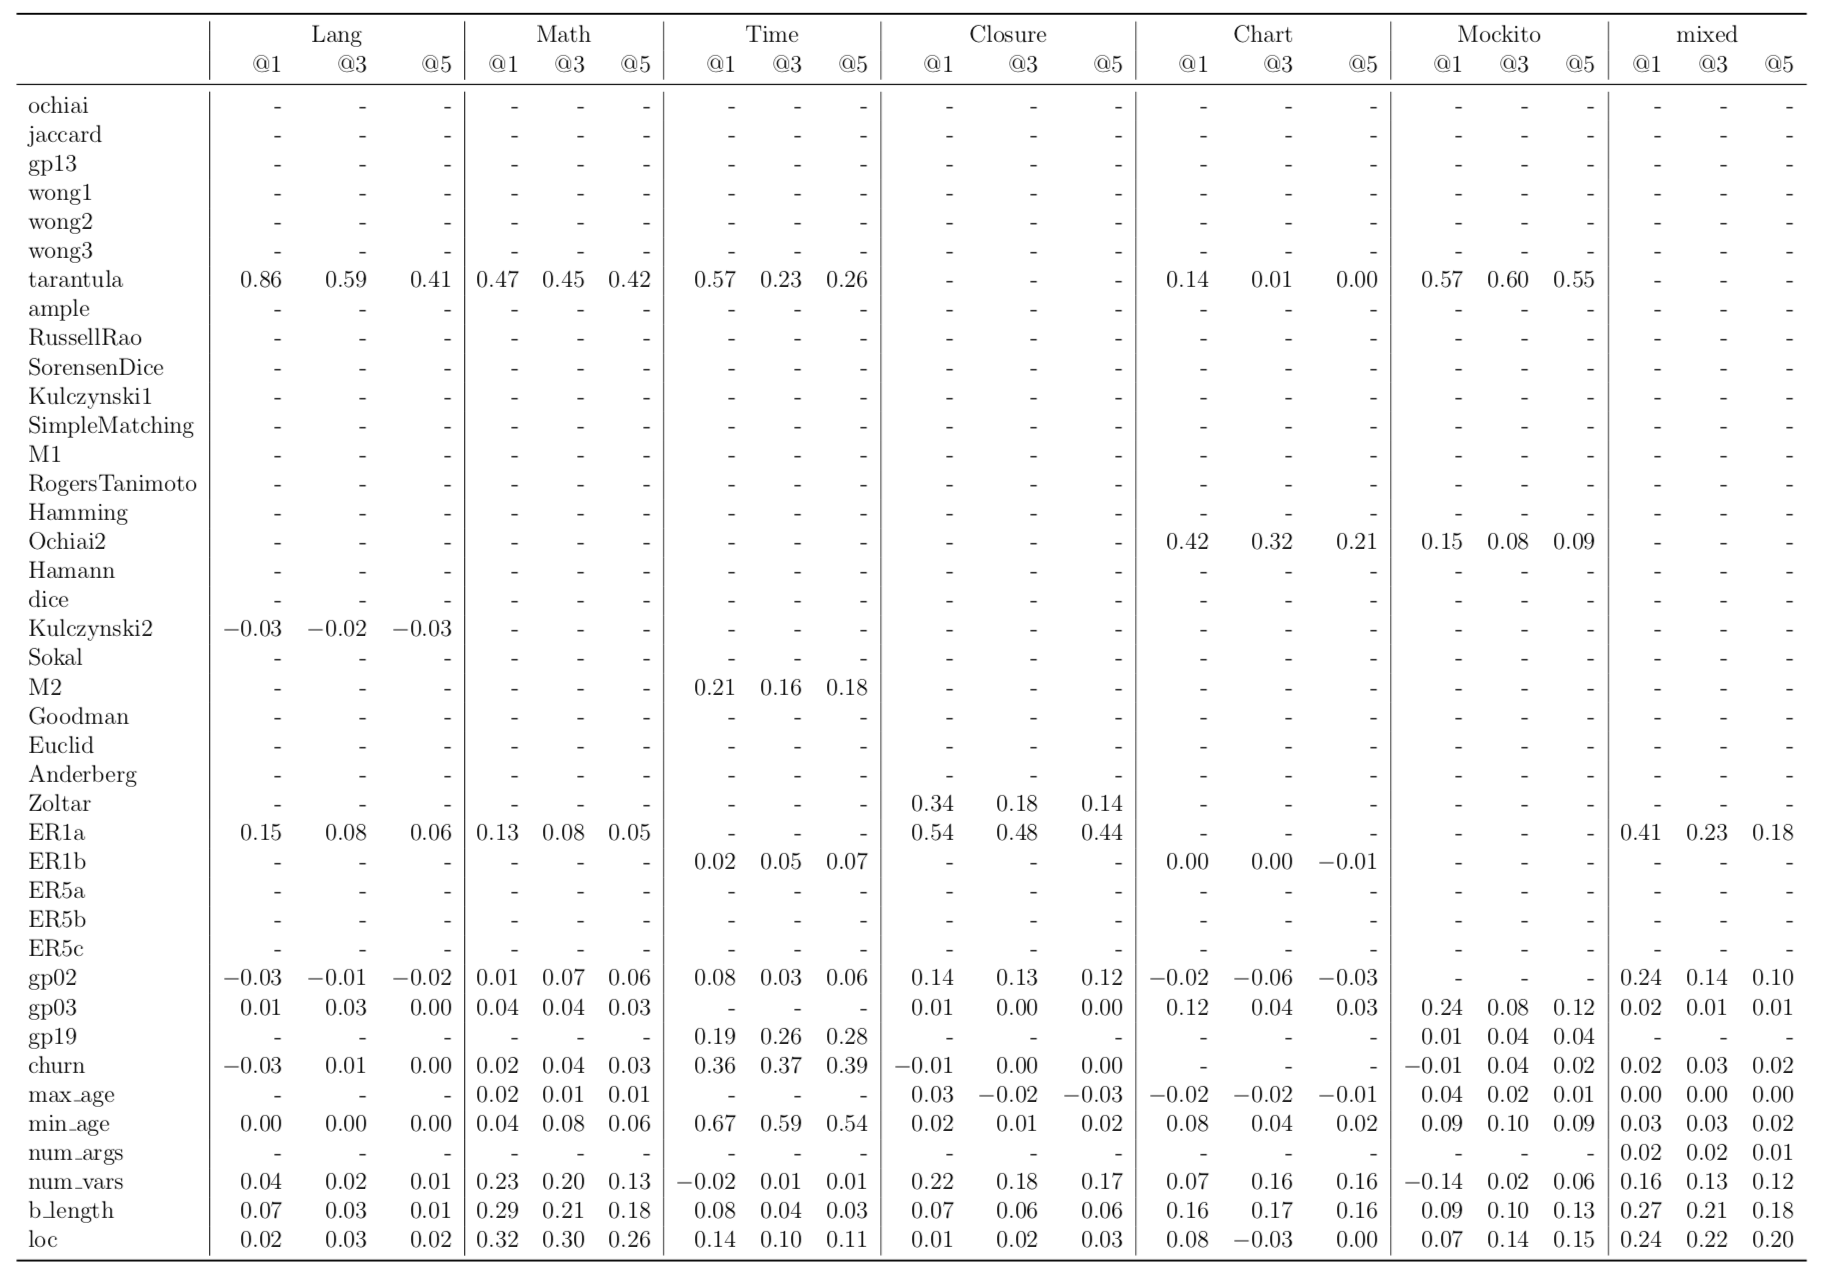
RQ7. Feature Importance
FLUCCS uses 33 SBFL score metrics and seven code and change metrics. To identify which features are useful in FLUCCS, we perform feature importance analysis using Random Forest and identify the top ten most effective features. For these top ten features, we directly measure their effect on the performance of fault localisation by randomly permutating each of these top ten features, one at a time. We, then, observe the performance difference in the models trained with that dataset against the performance of the models trained using the dataset before the permutation of the feature. The more severe the difference is, the more likely the feature to have more effect on fault localisation. In RQ7, we ask: which features contribute the most to ranking models? Below are the results of this experiment per project. The results include the tables of feature importance values of the top ten features in RF and the tables of a performance difference from the random permutation of these features.
| Feature Importance Analysis per Project |